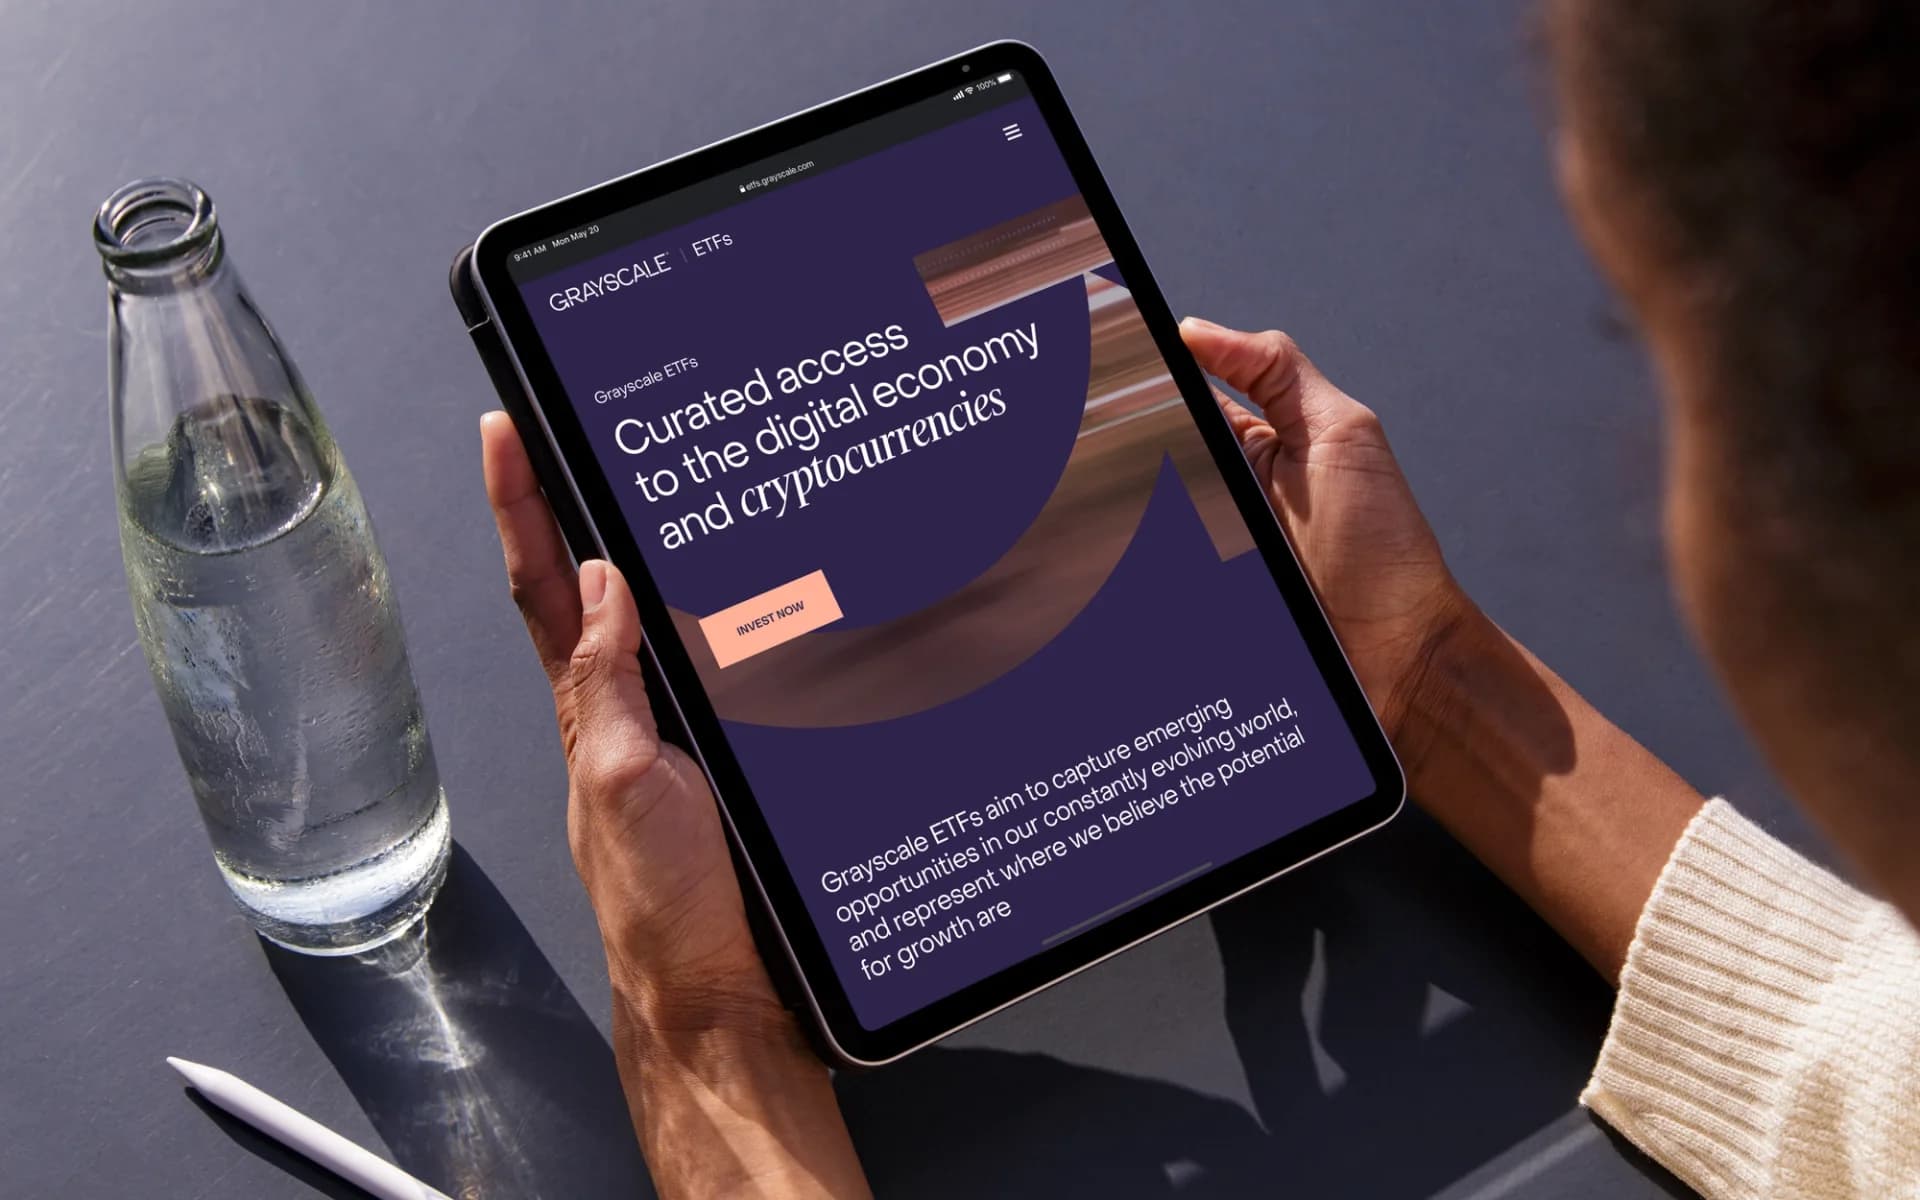
Grayscale
Introduction
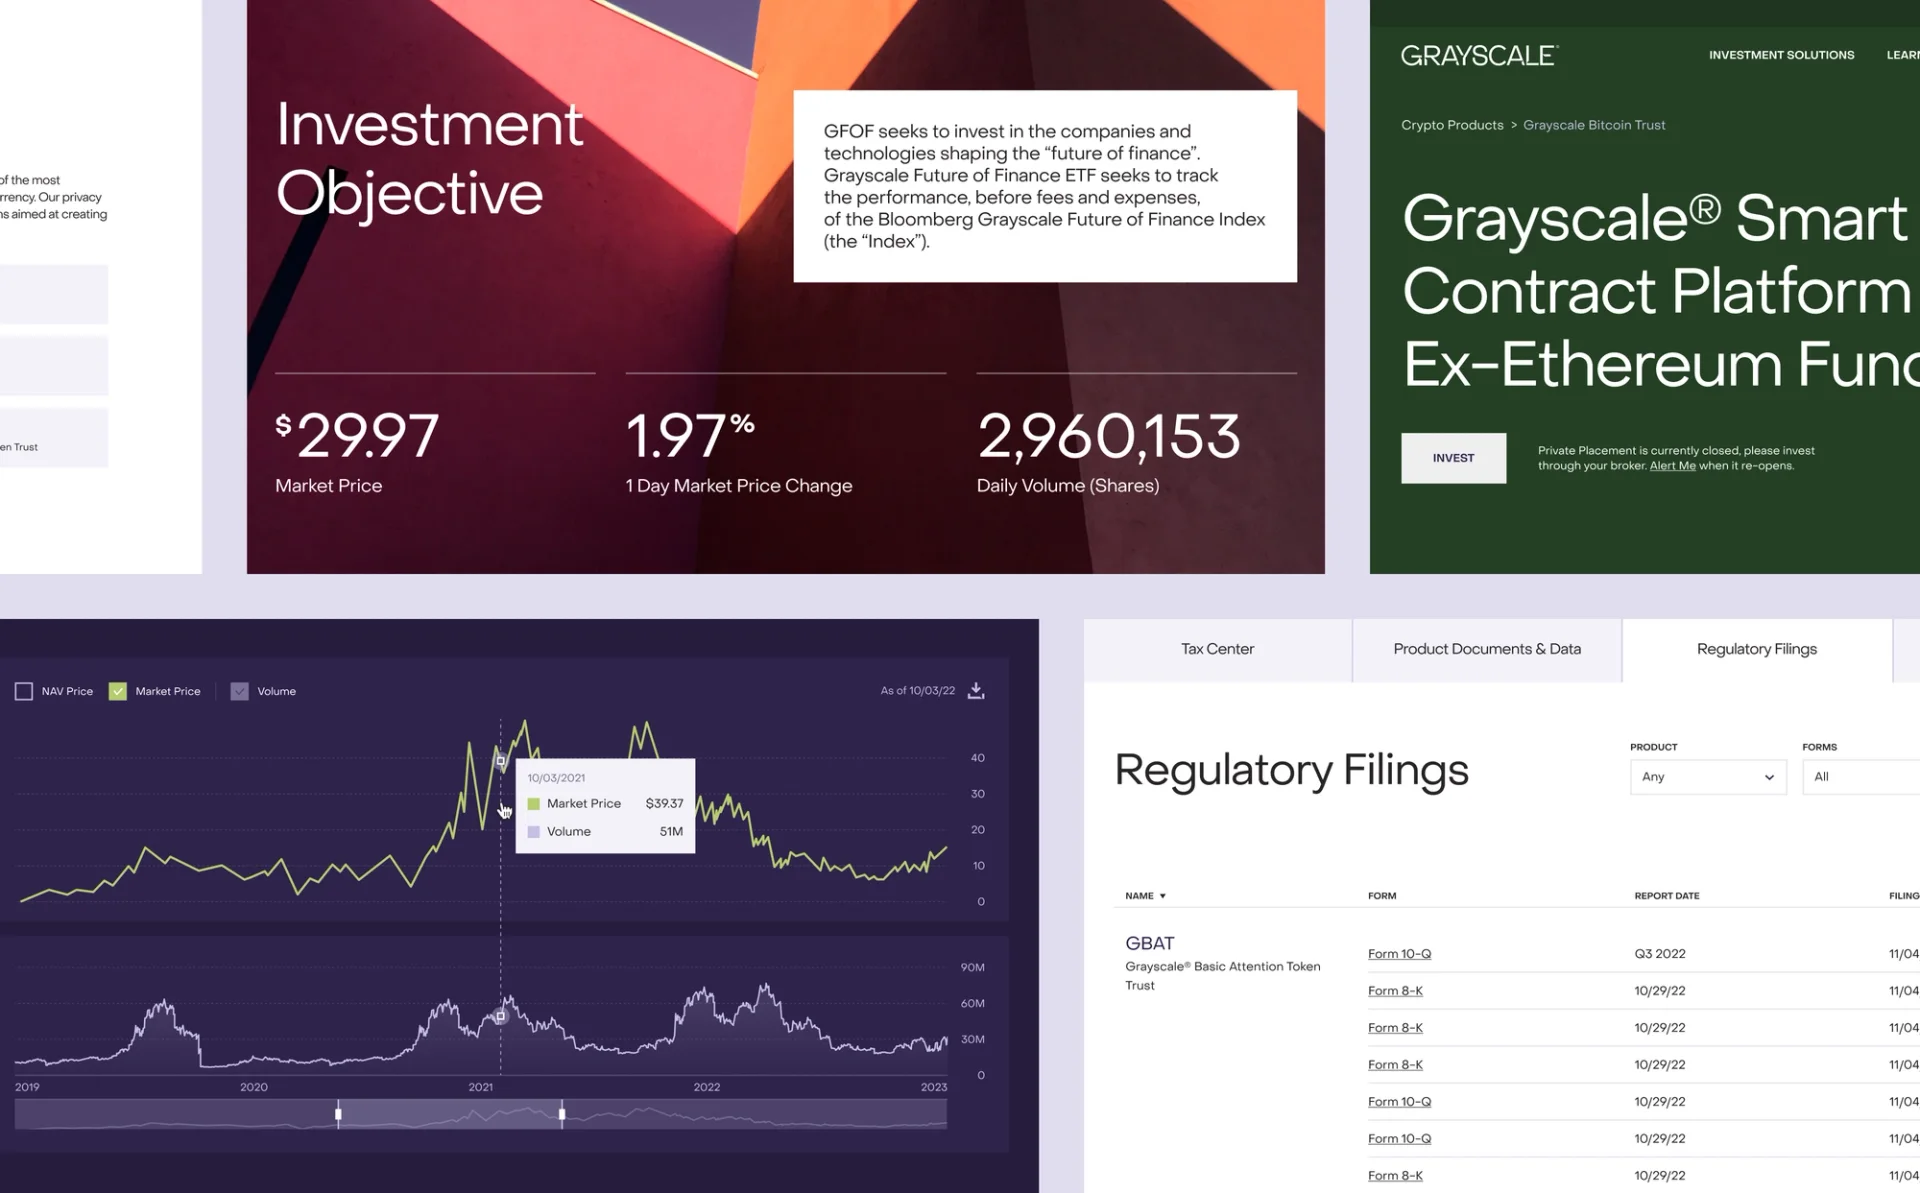
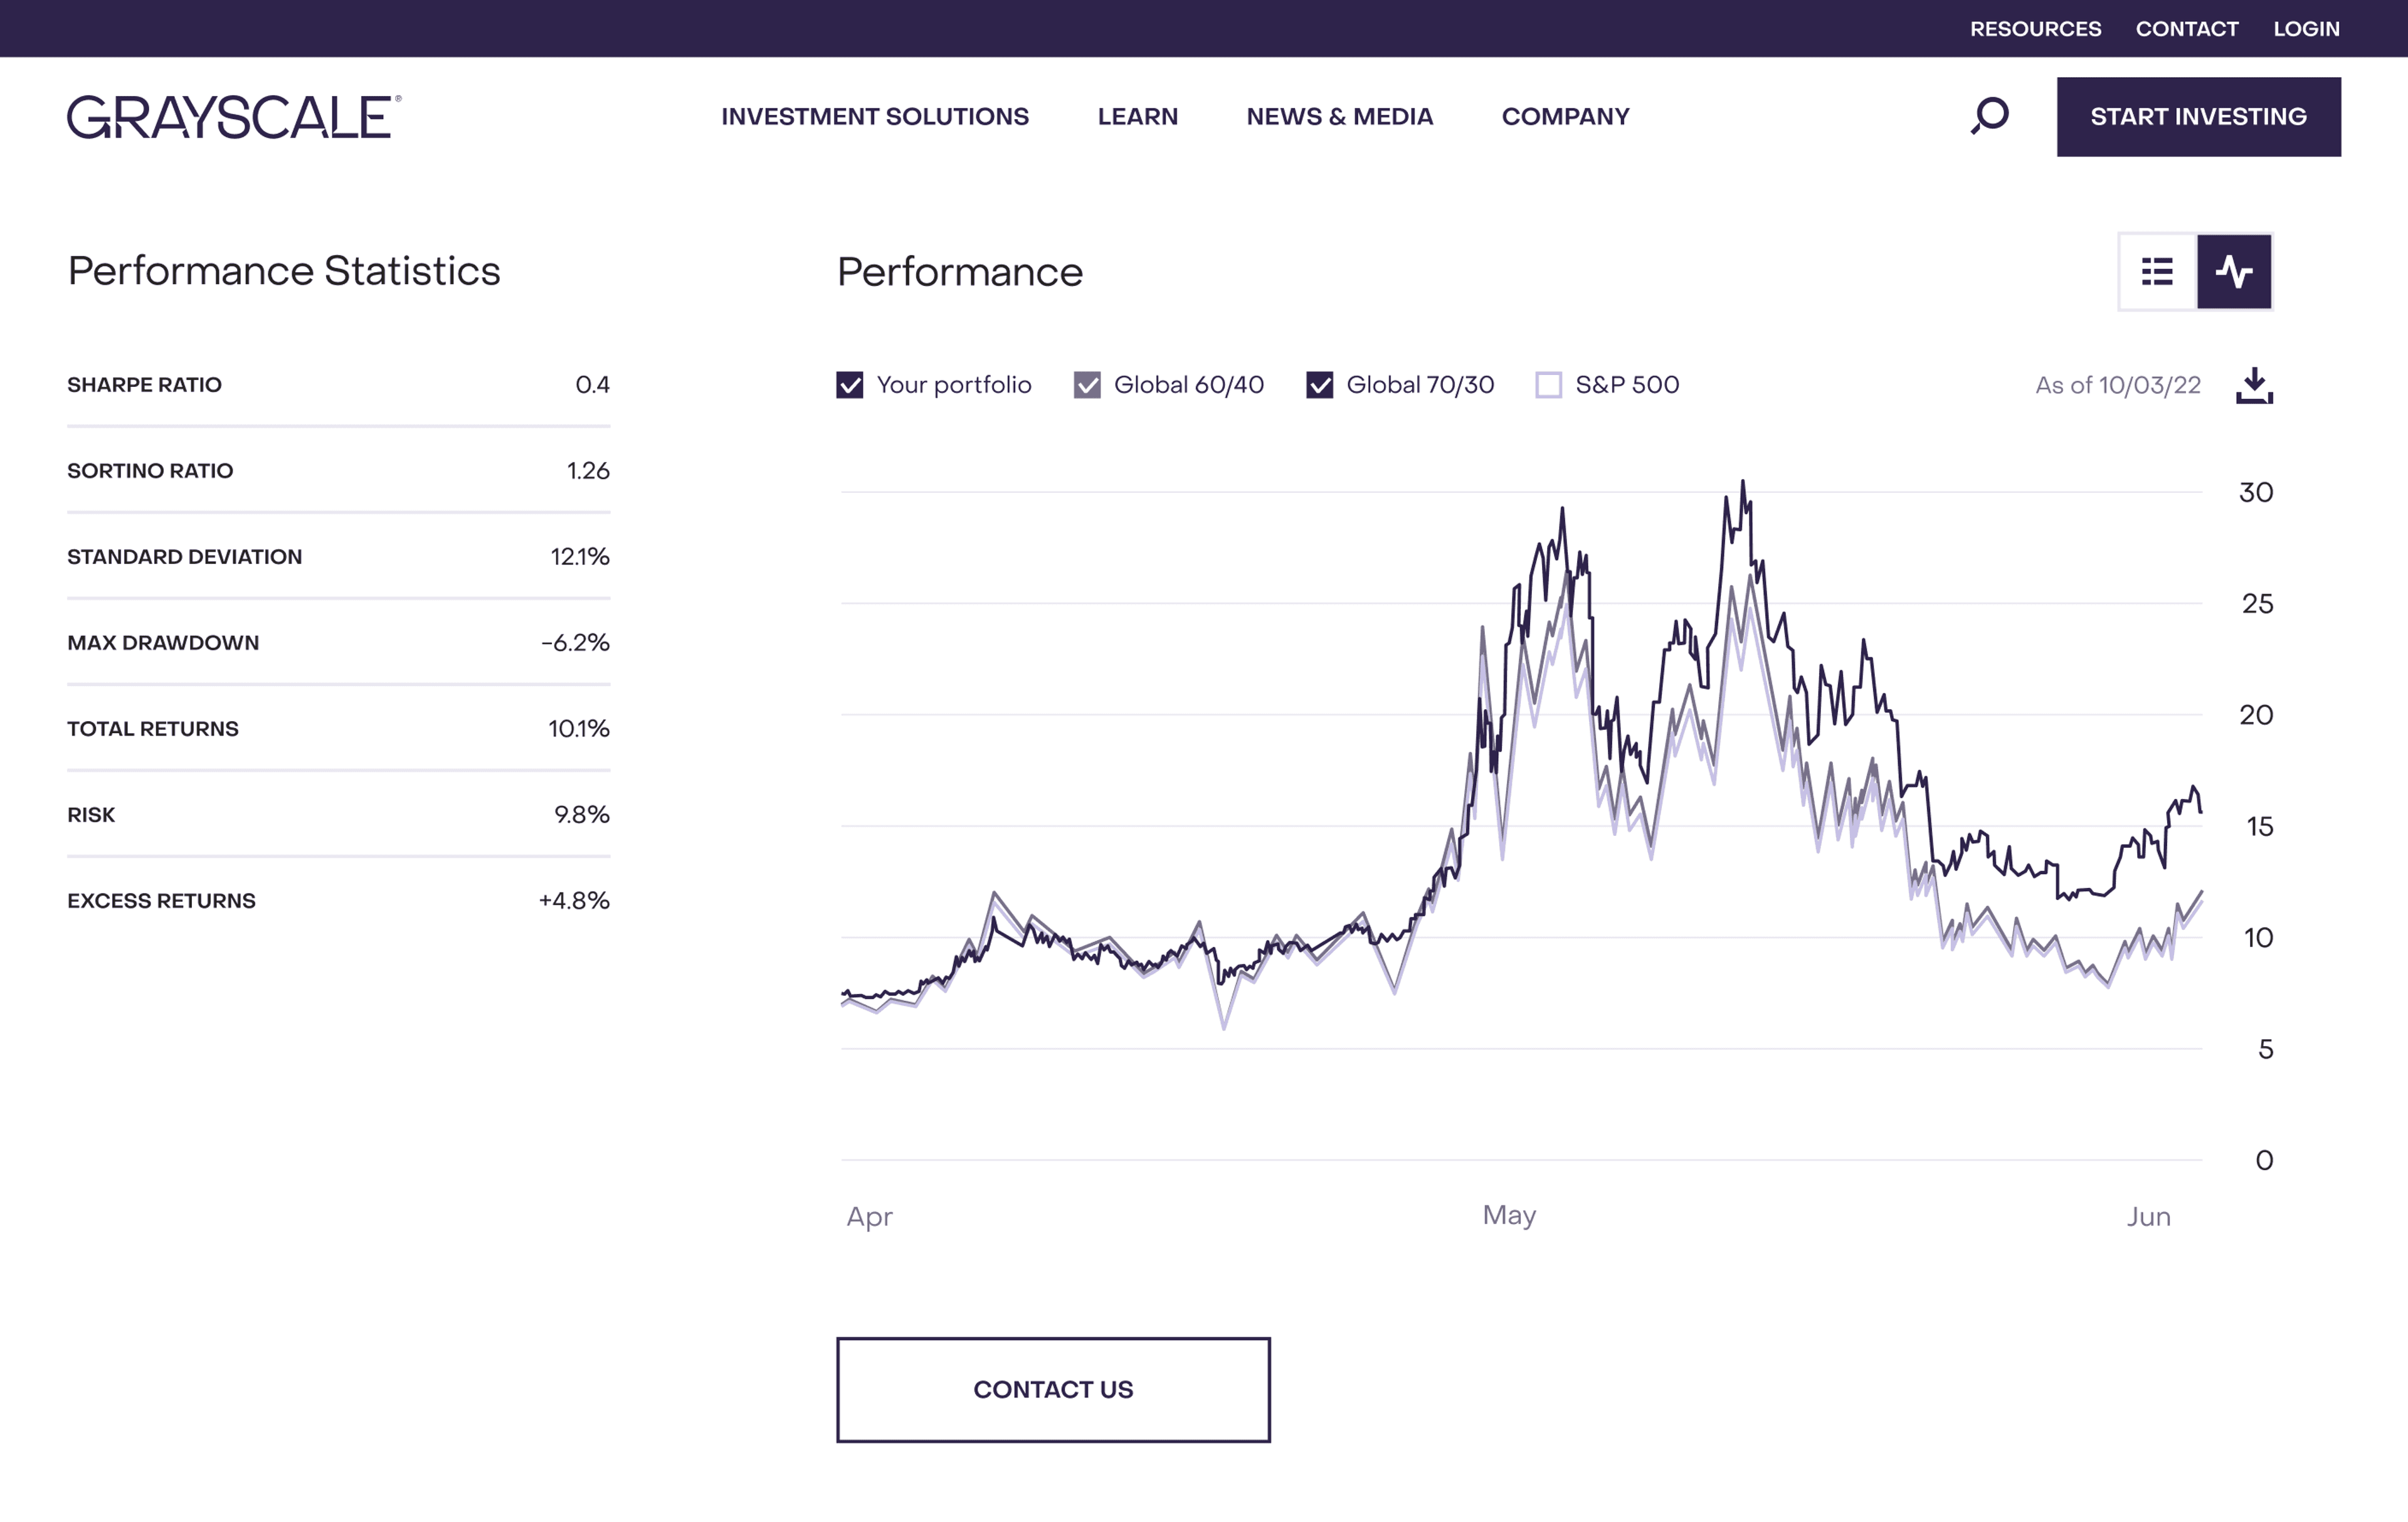
At Clay, my primary responsibility was developing the data-heavy product experiences used across Grayscale’s current website. I built interactive line and pie charts, data tables, and comparison views, connecting them to live data so market and fund information could update in real time without interrupting the interface.

Challenges
Real-time financial data without the friction
The core challenge was turning continuously changing fund and market data into interfaces that remained clear, fast, and dependable. I developed reusable charting and table patterns — including interactive pie charts, line charts, selectors, comparison states, and responsive data tables — so users could explore live information across products and devices.
Challenge 02
Charts designed for touch
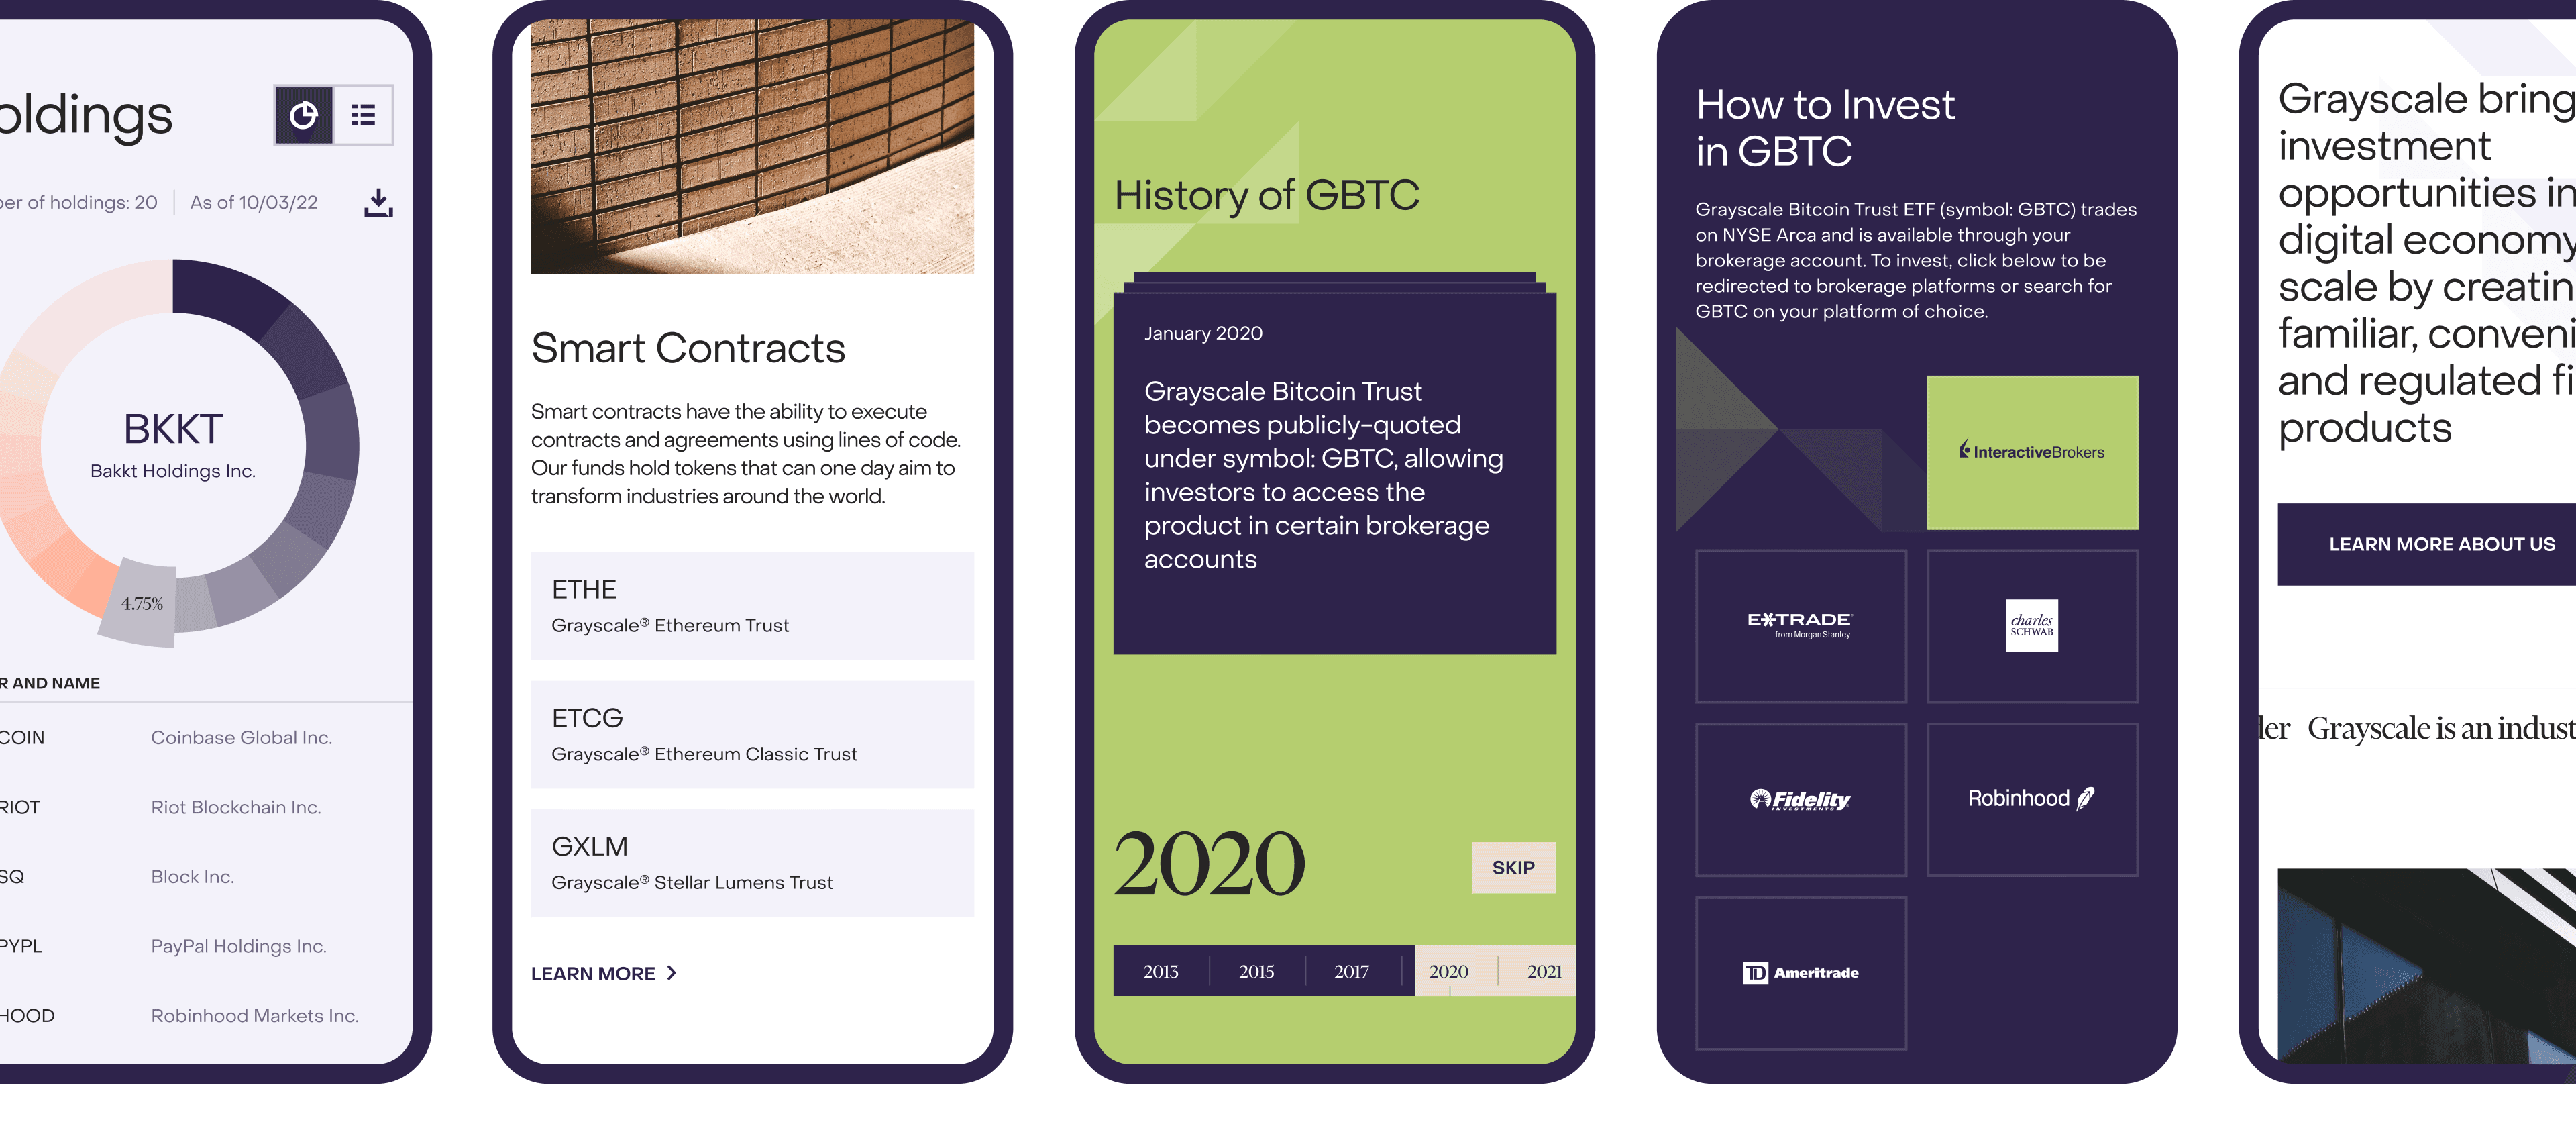
The second challenge was making every data experience work flawlessly on mobile devices. Charts and tables needed touch-first controls, gesture support, and clear navigation between values, periods, and data views — without relying on hover or sacrificing the precision available on desktop.
Final thoughts
Interactive data, always current
The resulting chart and table system gives users a direct way to understand allocation, performance, historical movement, and fund composition. Data updates in real time while the interface preserves consistent interactions, readable comparisons, and touch-friendly navigation across the current Grayscale website.